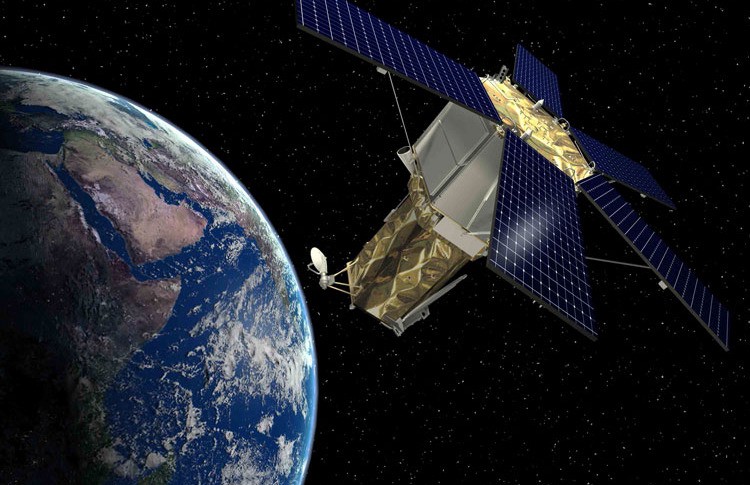
Remote sensing: principles, electromagnetic spectrum, components and applications
Remote sensing, also called earth observation, refers to obtaining information about objects or areas at the Earth’s surface without being in direct contact with the object or area. Humans accomplish this task with aid of eyes or by the sense of smell or hearing; so, remote sensing is day-today business for people. Reading the newspaper, watching cars driving in front of you are all remote sensing activities. Most sensing devices record information about an object by measuring an object’s transmission of electromagnetic energy from reflecting and radiating surfaces.
Principles of remote sensing
Detection and discrimination of objects or surface features means detecting and recording of radiant energy reflected or emitted by objects or surface material. Different objects return different amount of energy in different bands of the electromagnetic spectrum, incident upon it. This depends on the property of material (structural, chemical, and physical), surface roughness, angle of incidence, intensity, and wavelength of radiant energy.
The Remote Sensing is basically a multi-disciplinary science which includes a combination of various disciplines such as optics, spectroscopy, photography, computer, electronics and telecommunication, satellite launching etc. All these technologies are integrated to act as one complete system in itself, known as Remote Sensing System. There are a number of stages in a Remote Sensing process, and each of them is important for successful operation. Progressive stages in remote sensing are as follows:
- Emission of electromagnetic radiation, or EMR (sun/self- emission)
- Transmission of energy from the source to the surface of the earth, as well as absorption and scattering
- Interaction of EMR with the earth’s surface: reflection and emission
- Transmission of energy from the surface to the remote sensor
- Sensor data output
- Data transmission, processing and analysis
At temperature above absolute zero, all objects radiate electromagnetic energy by virtue of their atomic and molecular oscillations. The total amount of emitted radiation increases with the body’s absolute temperature and peaks at progressively shorter wavelengths. The sun, being a major source of energy, radiation and illumination, allows capturing reflected light with conventional cameras and films.
Electromagnetic radiation and Electromagnetic spectrum
EMR is a dynamic form of energy that propagates as wave motion at a velocity of c = 3 x 1010 cm/sec. The parameters that characterize a wave motion are wavelength (λ), frequency (ν) and velocity (c). The relationship between the above is:
c = νλ.
Electromagnetic energy radiates in accordance with the basic wave theory. This theory describes the EM energy as travelling in a harmonic sinusoidal fashion at the velocity of light. Although many characteristics of EM energy are easily described by wave theory, another theory known as particle theory offers insight into how electromagnetic energy interacts with matter. It suggests that EMR is composed of many discrete units called photons/quanta. The energy of photon is
Q = hc / λ = h ν
Where Q is the energy of quantum
h = Planck’s constant
Components of Remote Sensing System
Although, the remote sensing includes a wide array of technologies and types, but they all are based on certain common concepts with the same basic components. The basic components of remote sensing system are given below:
- Target
- Energy source
- Transmission path, and
The target is the object or material being studied. All the components in the system work together, to measure and record the information about the target without making physical contact. The energy source illuminates or provides electromagnetic energy to the target.
The energy interaction with the target depends on the target properties and the radiation. It also acts as a medium for transmitting the information from target to the sensor. The sensor is a remote device to collect and record the electromagnetic radiation.
Sensors are also used to measure the given-off energy or emitted energy by the target; reflected-off energy of the target; or transmitted energy from the target. After recording of energy, the resulting set of data is transmitted to the receiving station.
At receiving station, the data is processed to a usable format, i.e., in the form of image. The image is then interpreted to extract the informations about target. The interpretation of image can be done visually or electronically with the help of computers and image processing softwares.
Remote Sensing Applications
Land Use Mapping
Remote sensing data is useful in obtaining up-to-date land use pattern of large areas at any given time and also monitor changes that occur from time to time. It can be used for updating road maps, asphalt conditions, and wetland delineation. This information is used by regional planners and administrators to frame policy matters for all-round development of the region.
Weather Forecasting
Remote sensing is extensively used in India for weather forecasting. It is also used to warn people about impending cyclones.
Environmental Study
It can be used to study deforestation, degradation of fertile lands, pollution in atmosphere, desertification, eutrophication of large water bodies and oil spillage from oil tankers.
Study of Natural hazards
Remote sensing can be used to study damages caused by earthquakes, volcanoes, landslides, floods and melting of ice in polar regions. Many times remote sensing will be helpful to predict the occurrence of natural hazards.
Resource exploration
Remote sensing data is helpful for updating existing geological maps, rapid preparation of lineament and tectonic maps, identifying the sites for quarrying the minerals and helpful in locating fossil fuel deposits.
MPPCS Notes brings Prelims and Mains programs for MPPCS Prelims and MPPCS Mains Exam preparation. Various Programs initiated by MPPCS Notes are as follows:-
- MPPCS Mains 2025 Tests and Notes Program
- MPPCS Prelims Exam 2025- Test Series and Notes Program
- MPPCS Prelims and Mains 2025 Tests Series and Notes Program
- MPPCS Detailed Complete Prelims Notes 2025
